How Bass Forecast Simplifies Bass Fishing
Bass science made simple®
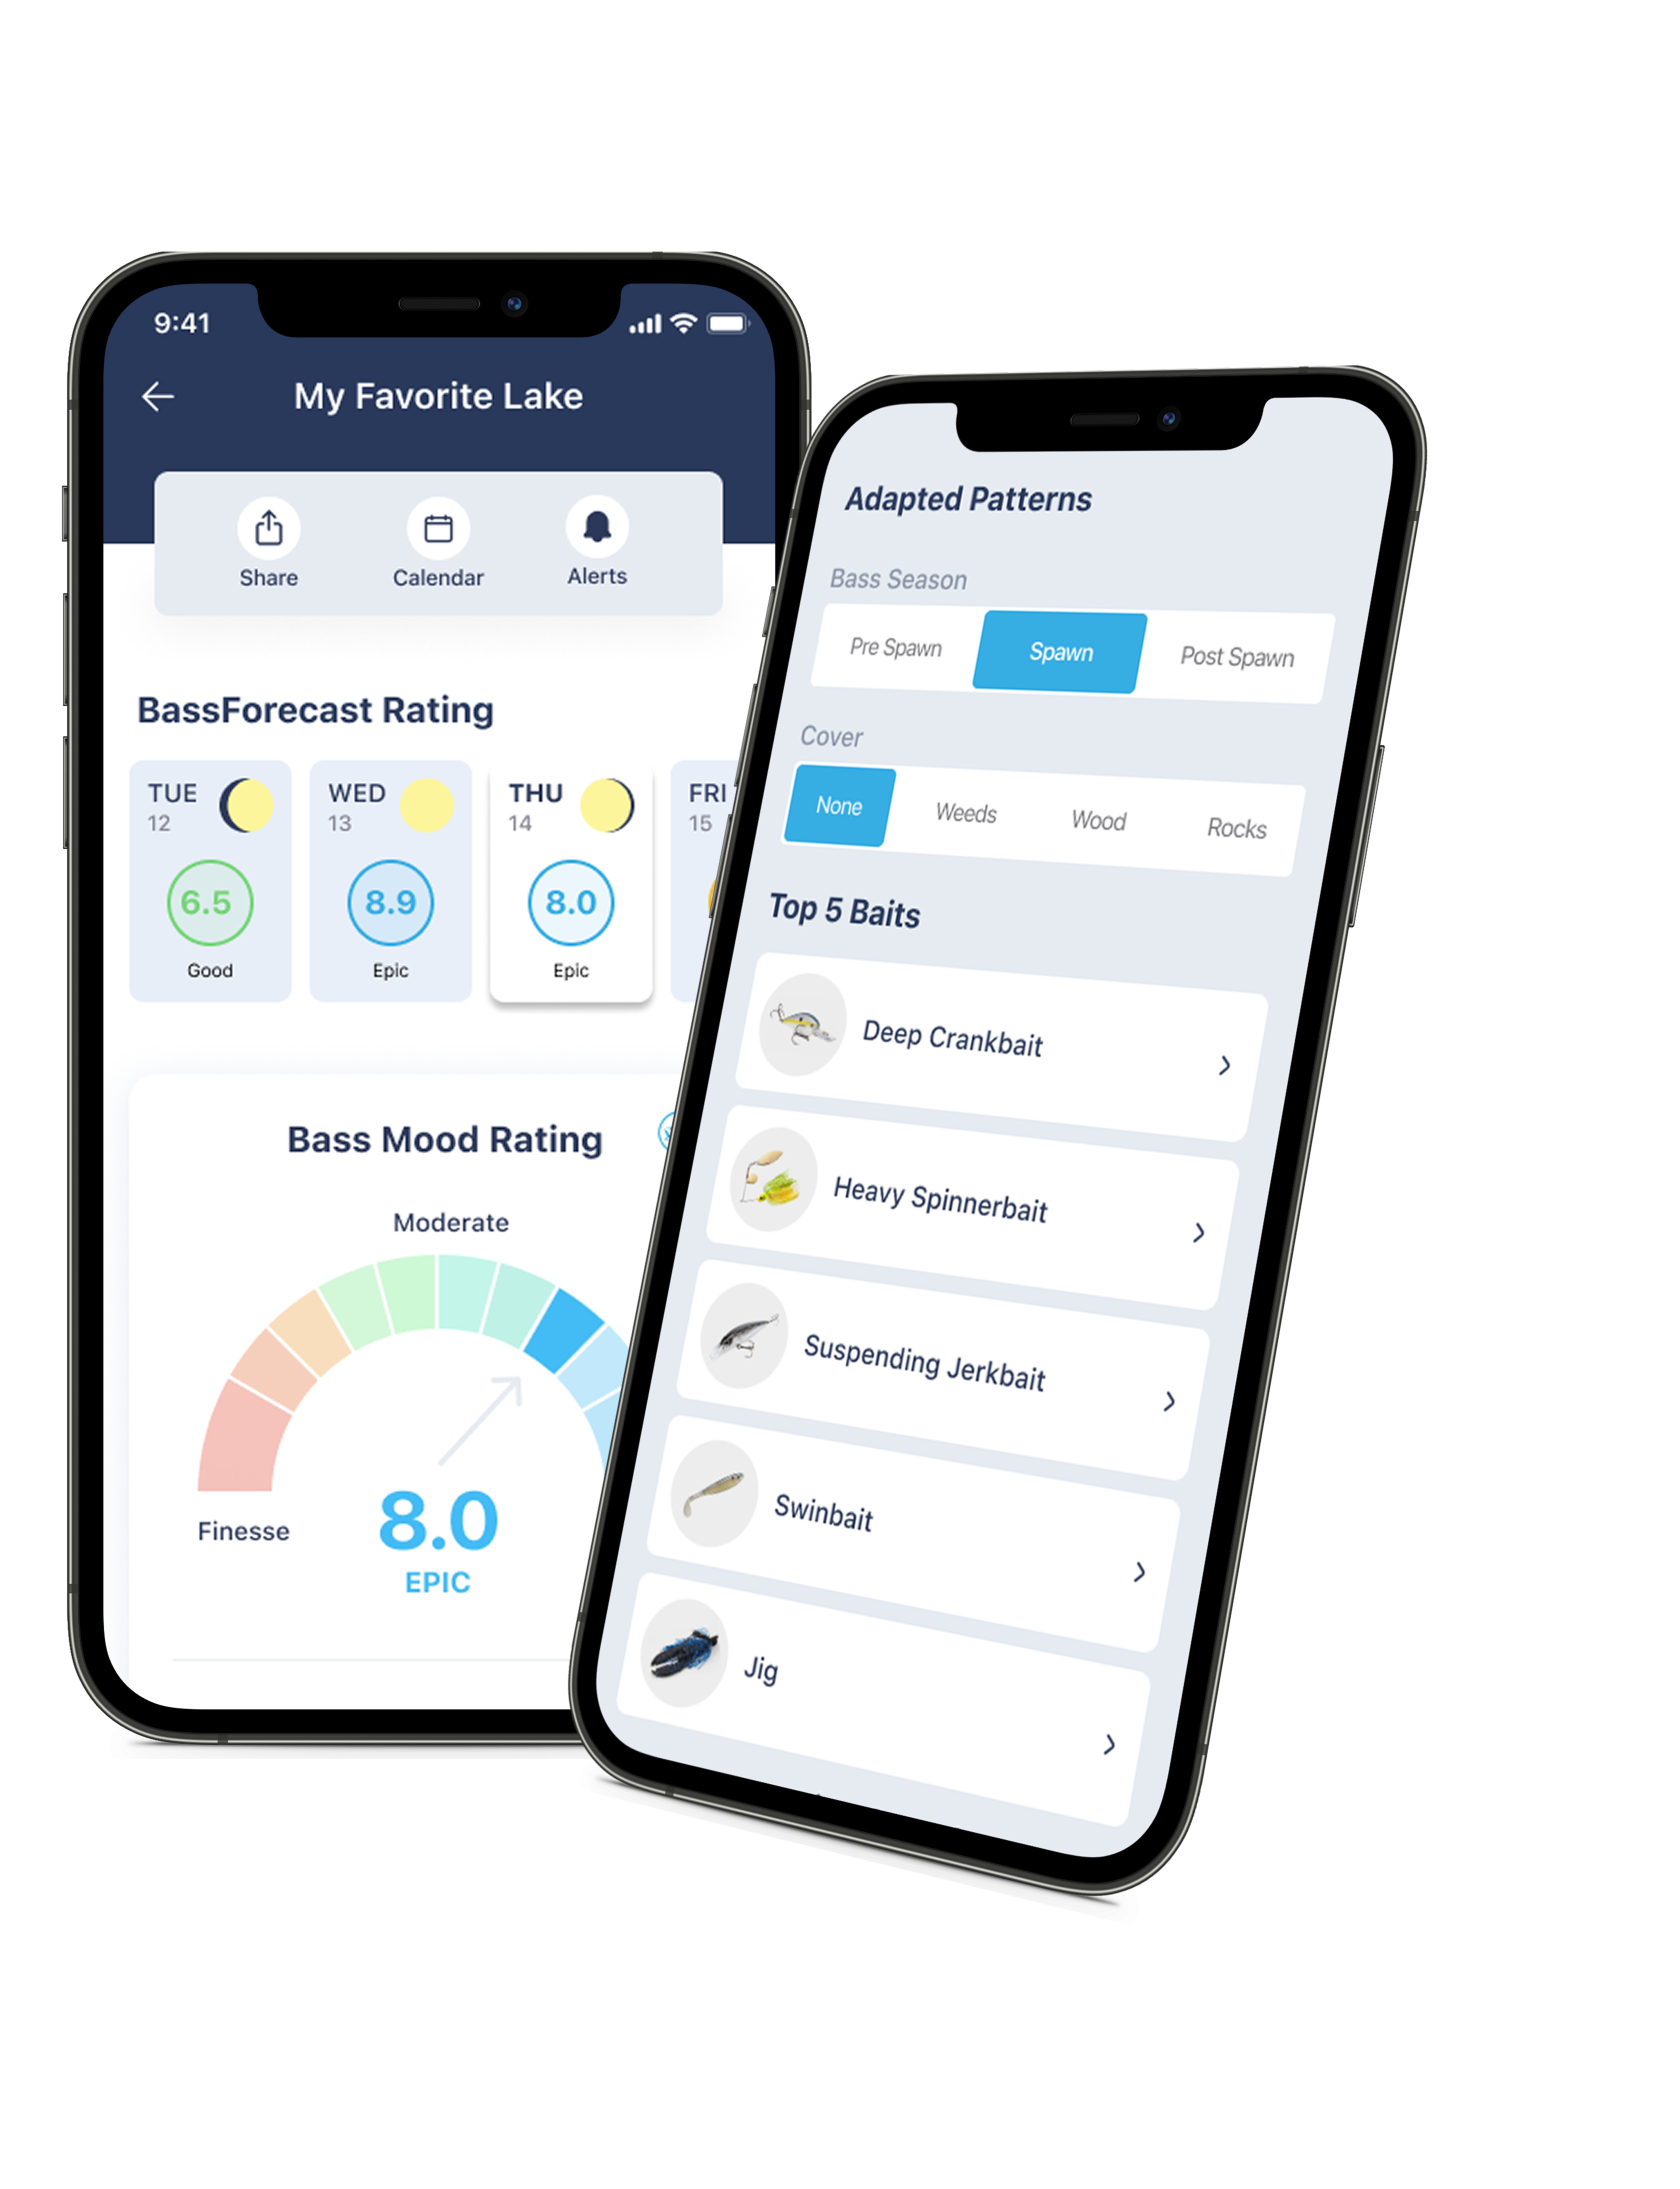
Bass Forecast, the #1 bass fishing app, turns complex weather data and bass behavior science into a simple, fish-catching plan. Get personalized fishing forecasts, bait recommendations, and pro-level strategies to land more bass with ease.
Download Bass Forecast now!
Easy Bass Fishing Trip Planning in 3 Steps
Our bass fishing app, makes trip planning simple and fast. Follow these steps to get personalized fishing forecasts and catch more bass!
Enter Your
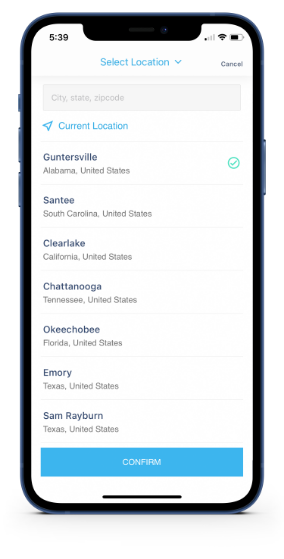
Fishing Location
Input your fishing spot to get tailored bass fishing forecasts in seconds powered by Bass Forecast AI.
View Your Bass Forecast Ratings
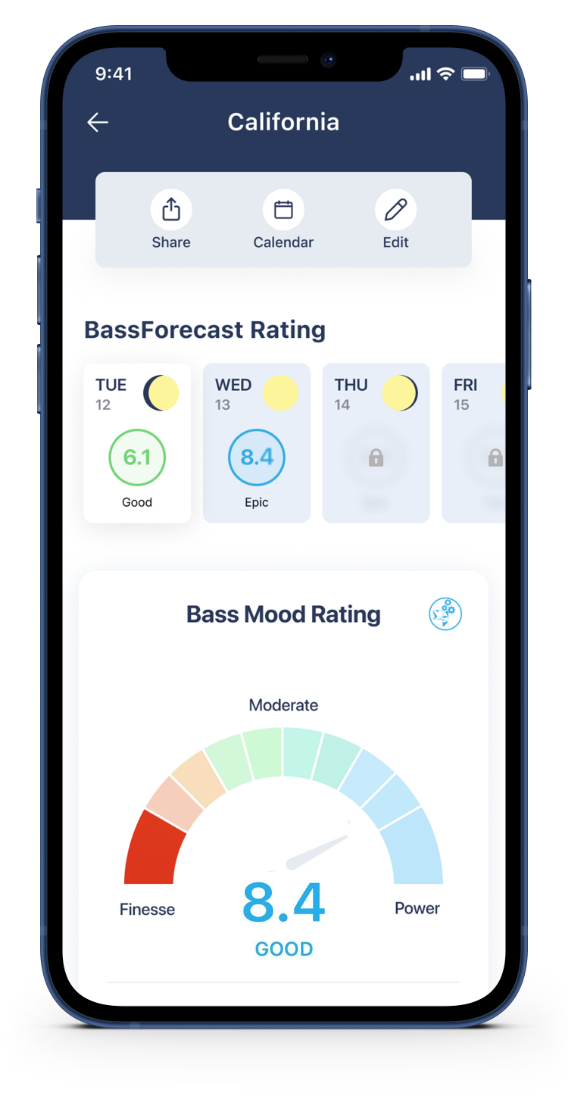
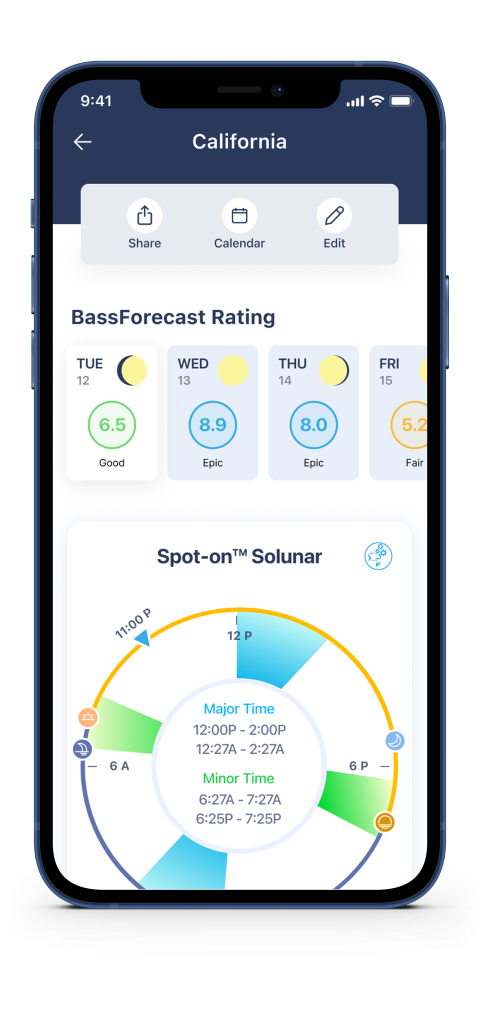
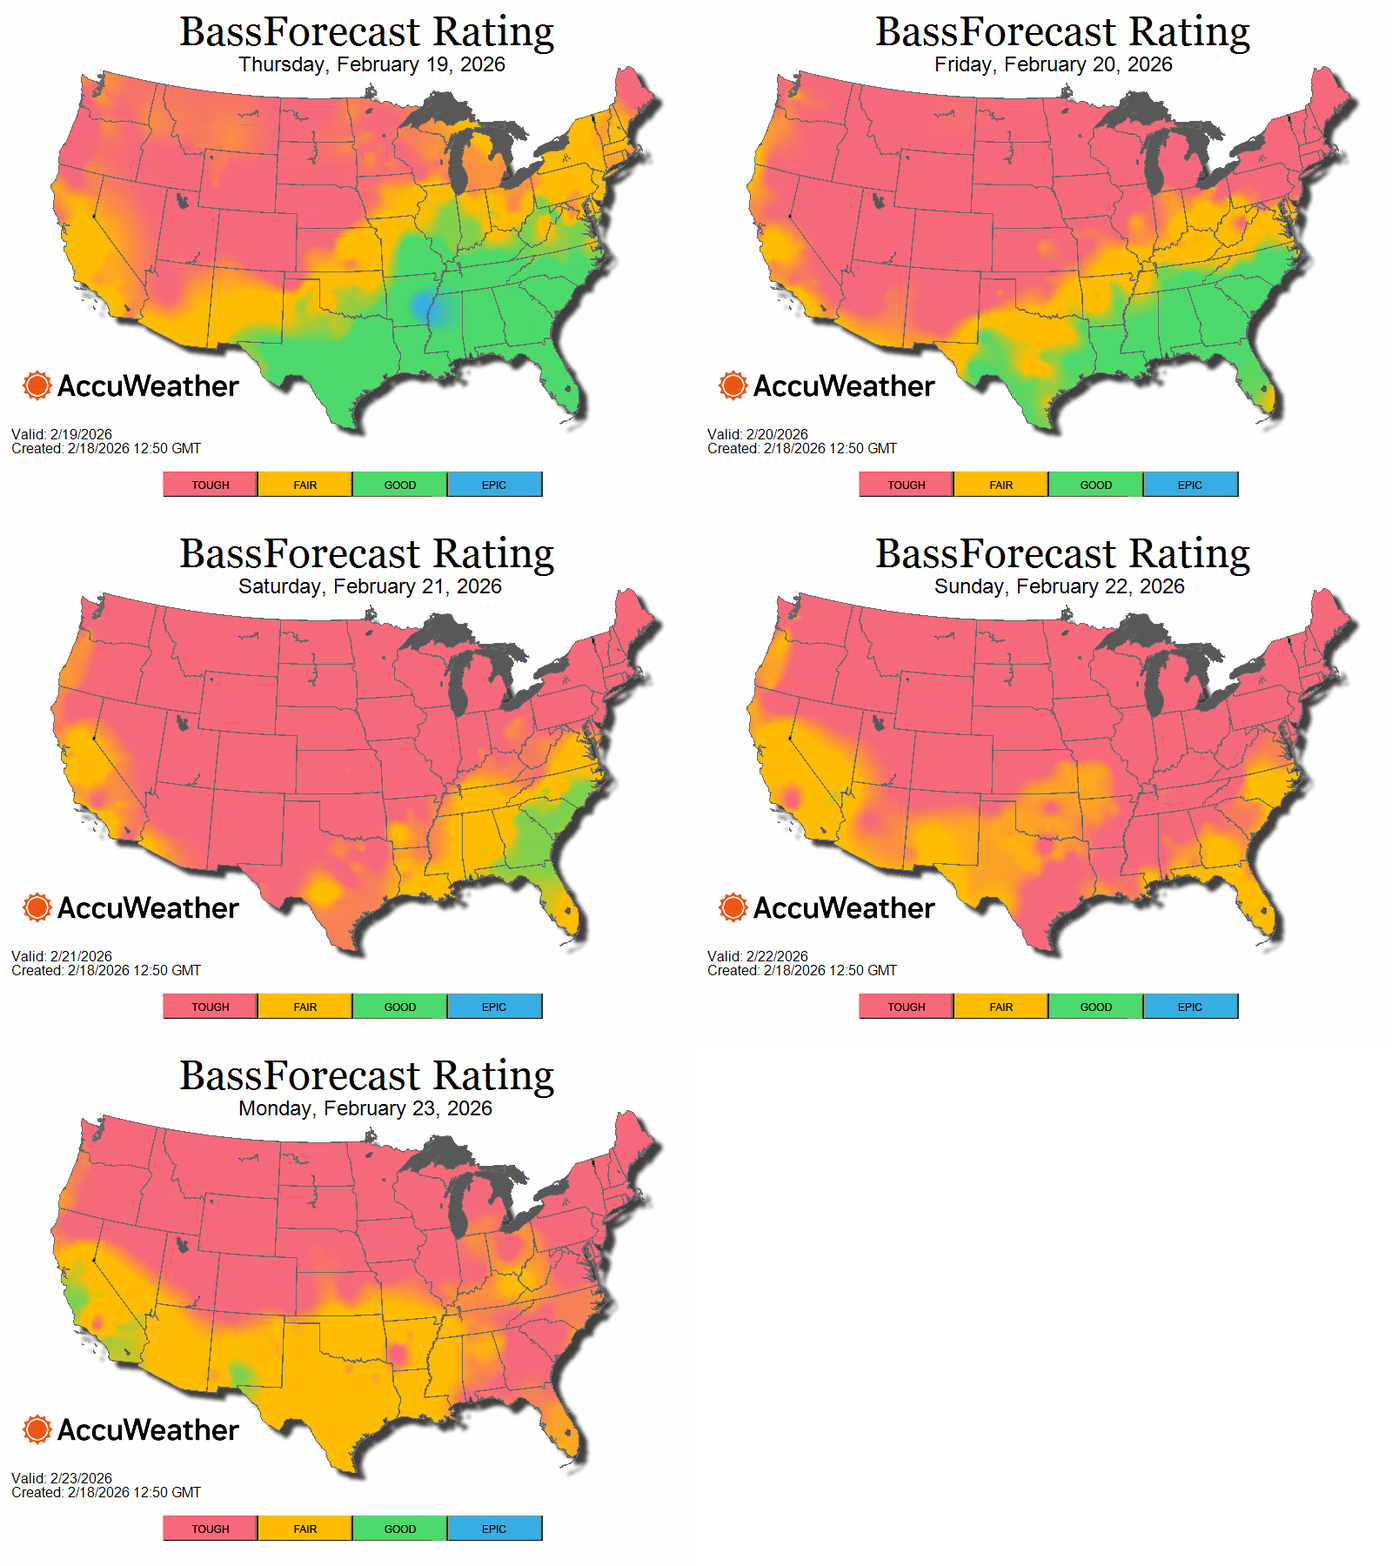
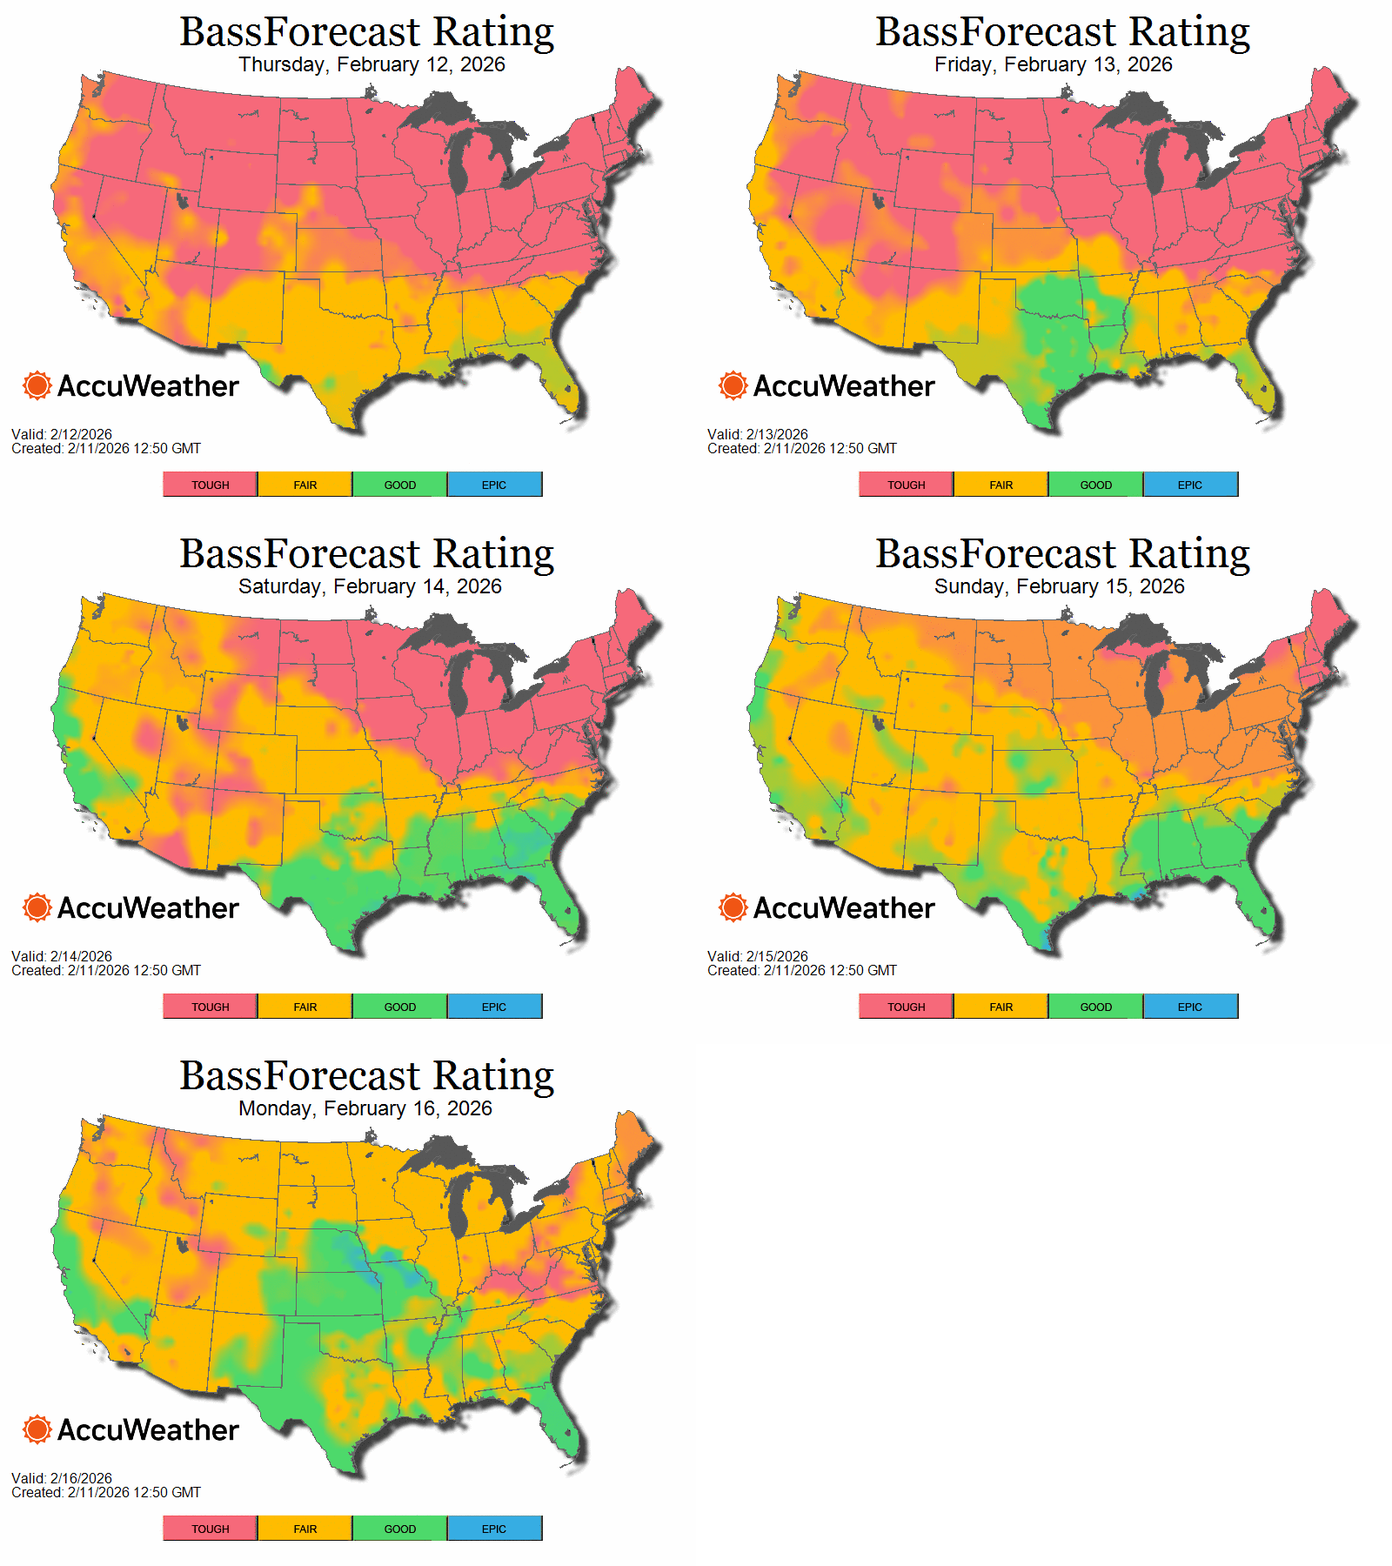
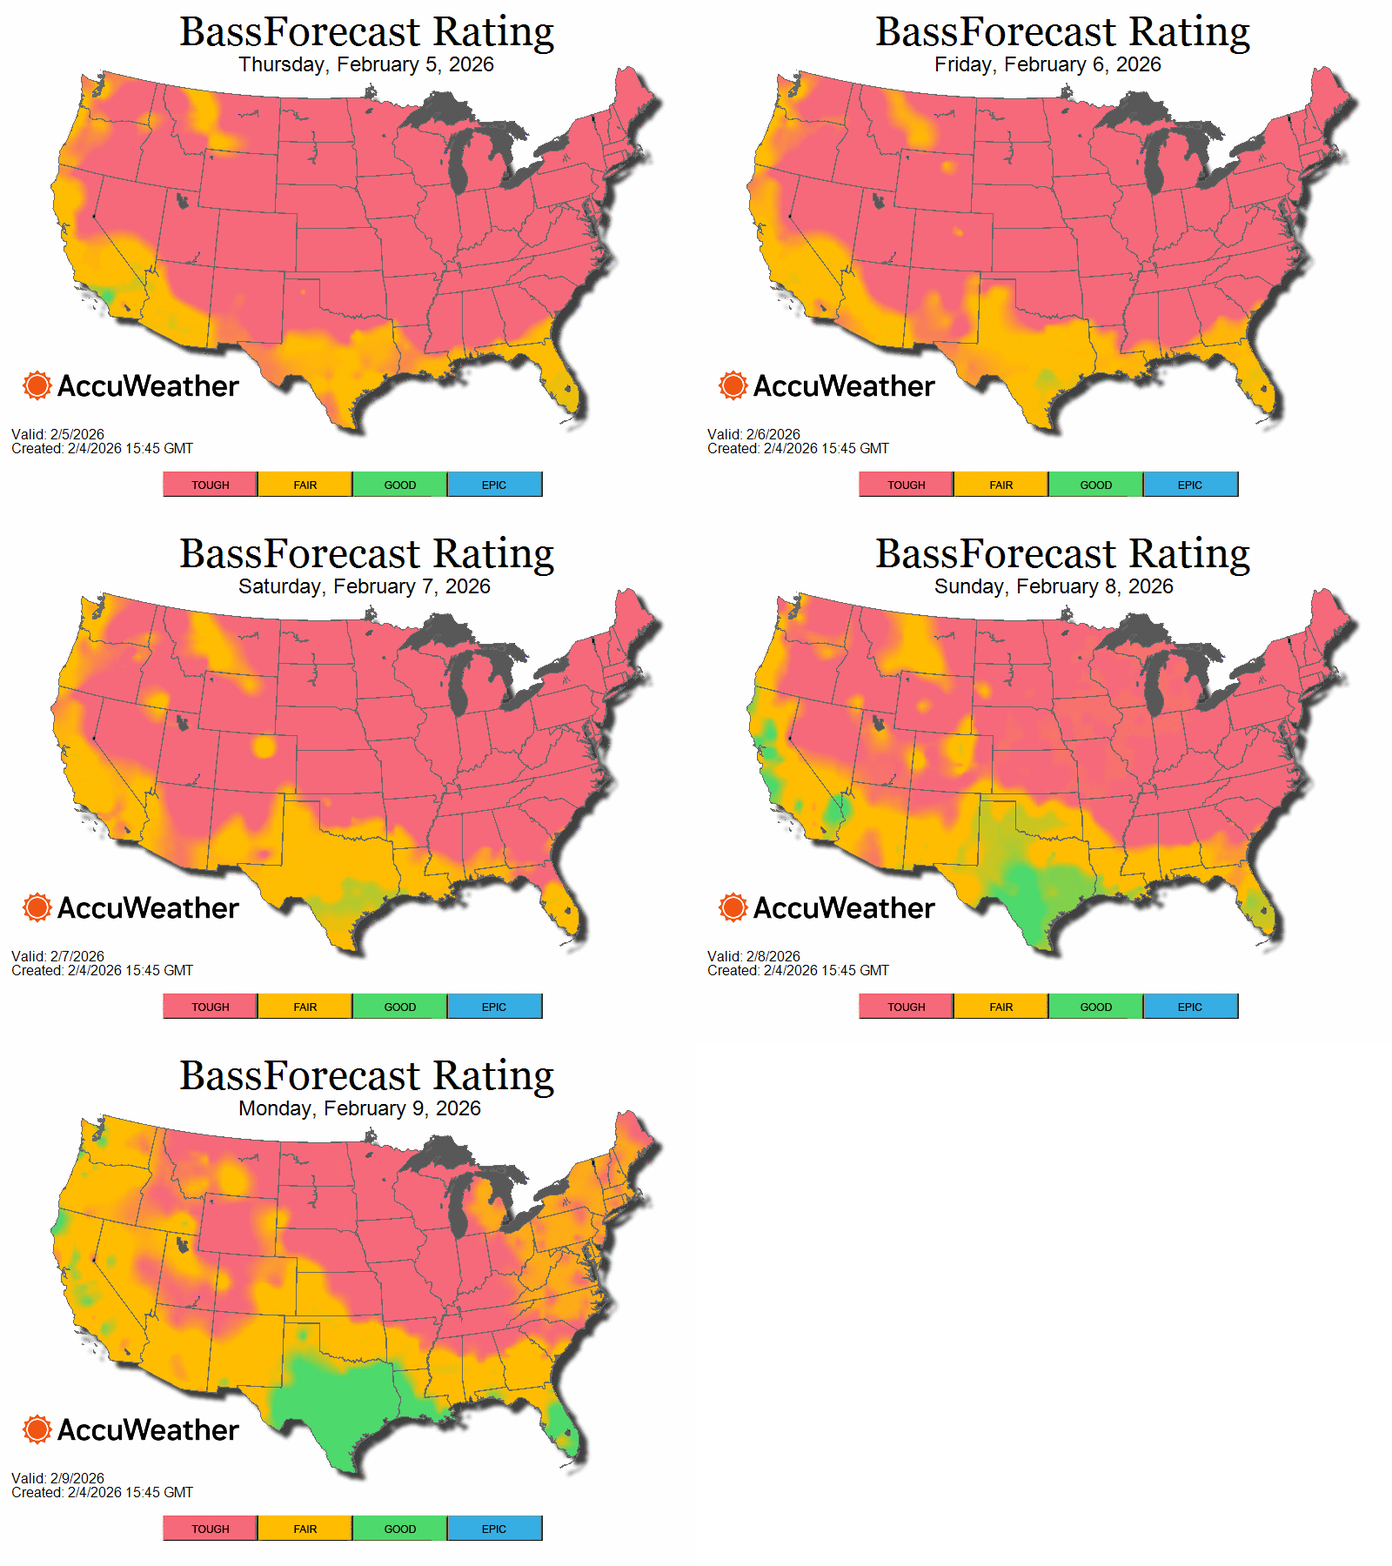
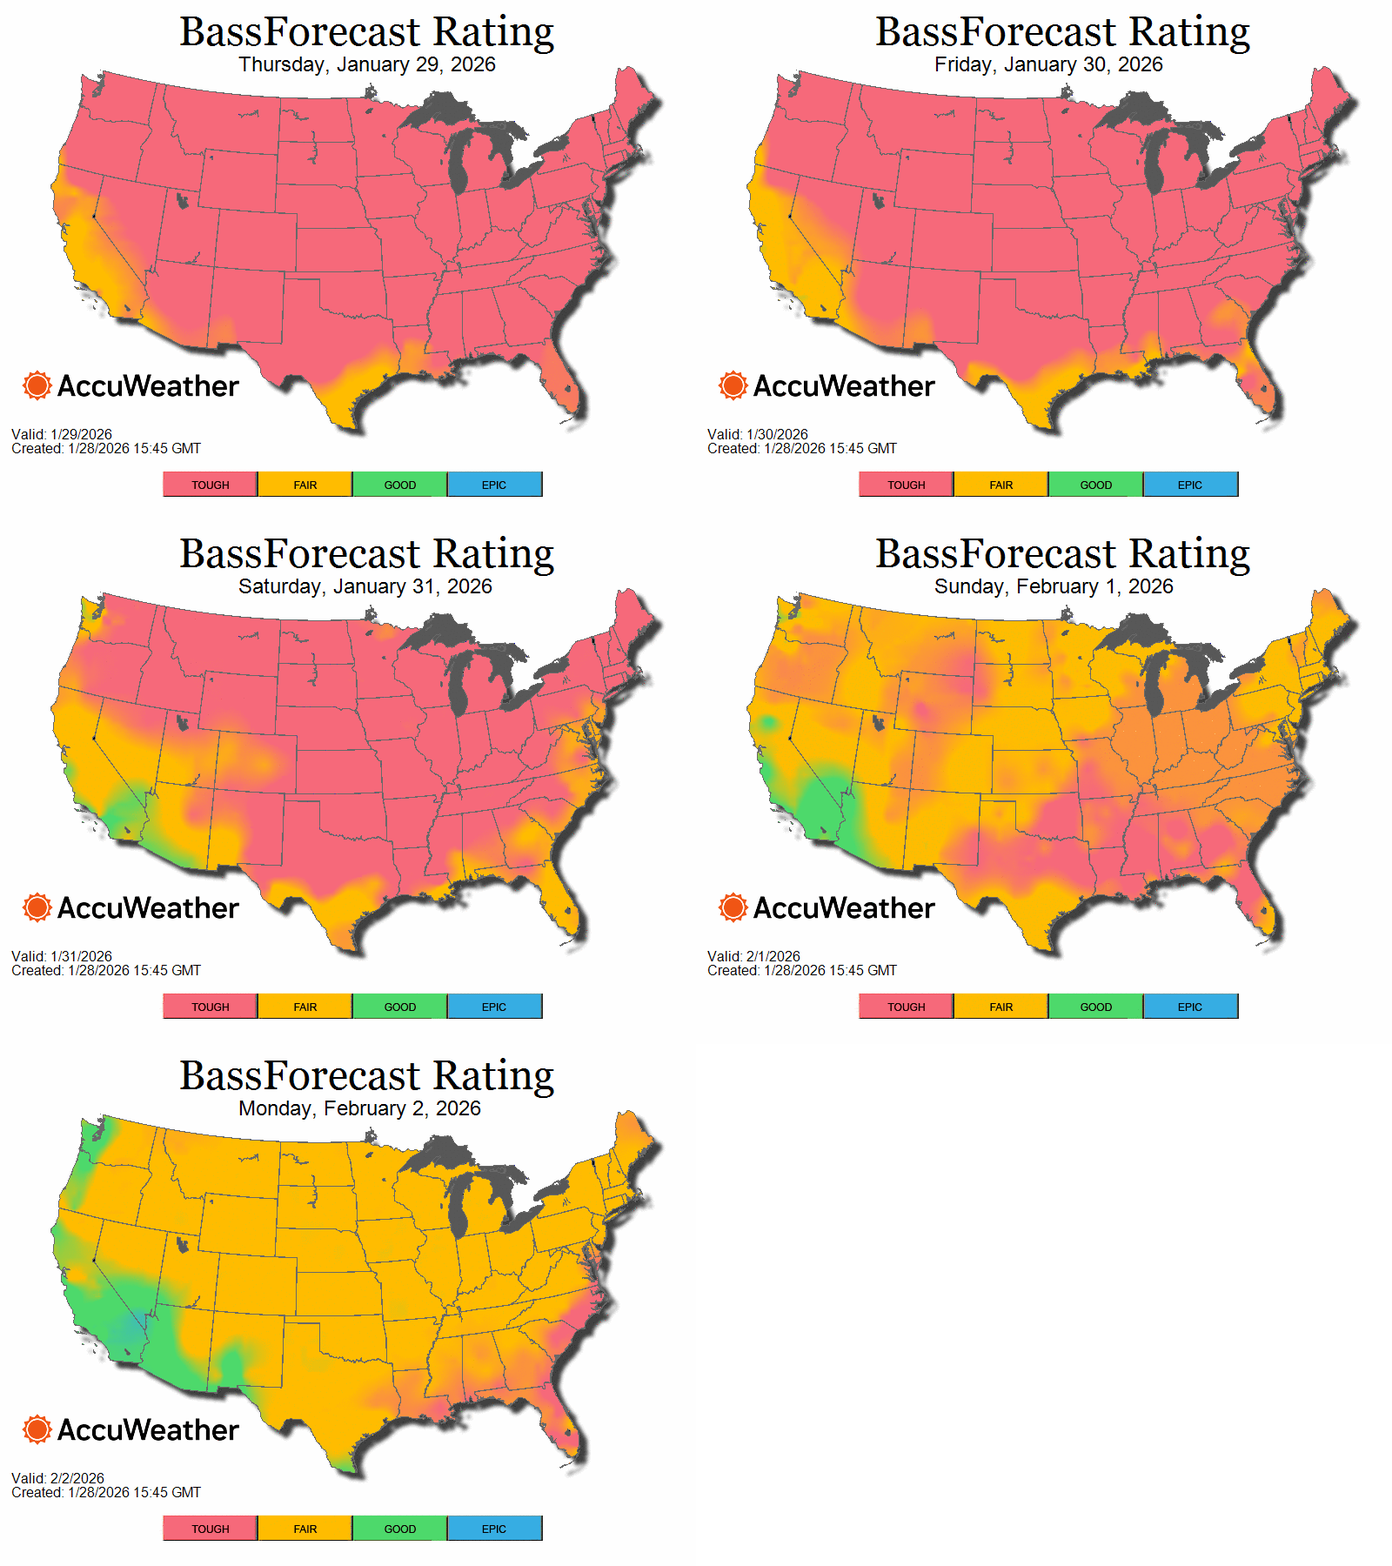
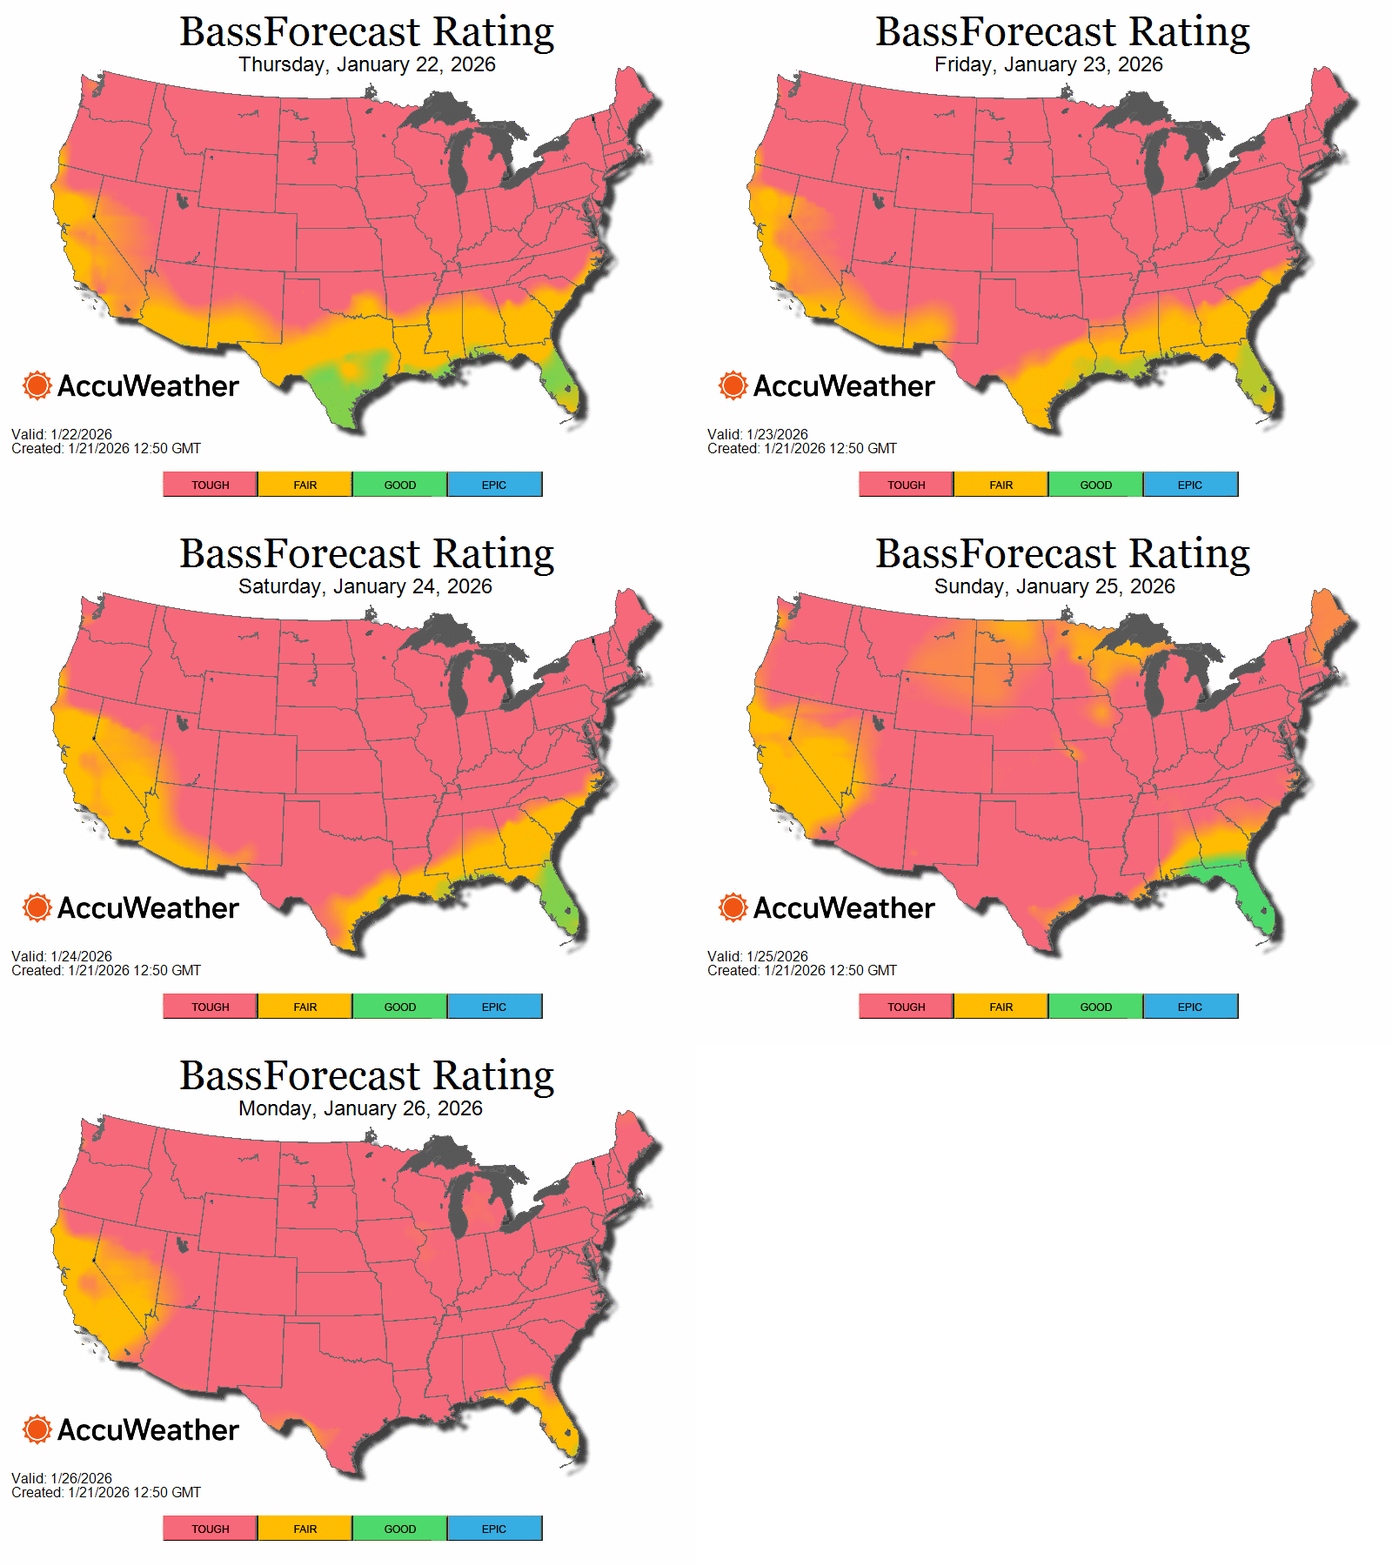
Check your 10-day Bass Forecast Ratings (BFR) to identify GOOD and EPIC
fishing days.
Plan Fishing Trips
Like A Pro
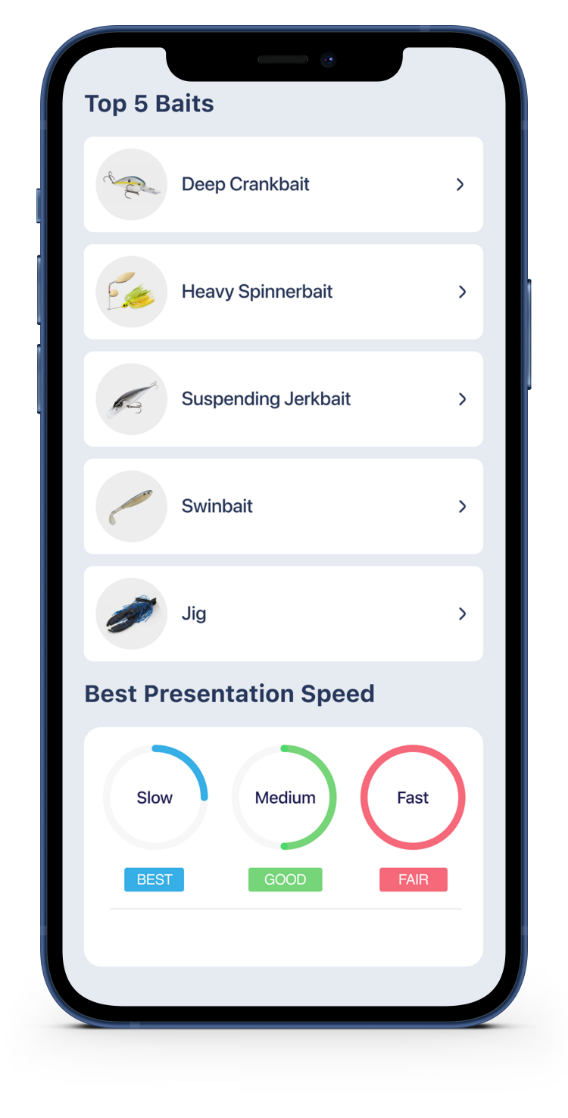
Get top baits, lake locations, and strategies tailored to weather, season, and bass behavior.
Why Bass Forecast’s AI-Powered Ratings
Are Unmatched
Bass Forecast, the #1 bass fishing app, uses advanced AI to deliver precise Bass Forecast Ratings (BFR). Our AI analyzes real-time AccuWeather data, solunar calendars, and bass behavior patterns across 9 seasons and 22 bait types. Backed by a 12-month research process.
A 6-month study with a pro guide, BFR predicts GOOD and EPIC fishing days with catch rates up to 4X above average. Even on TOUGH or FAIR days, our app equips you to plan fishing trips smarter
How AI Powers Bass Forecast’s Accurate Ratings
Bass Forecast’s AI analyzes key environmental factors to deliver precise Bass Forecast Ratings (BFR), helping you catch more bass. Powered by real-time AccuWeather data and GPS-specific solunar calendars, our app creates a fish-catching plan tailored to your location.

Barometer
Tracks pressure trends to predict bass feeding behavior, giving you a head start on changing weather.

Moon Phases
Adjusts ratings for new and full moons to optimize your fishing during peak lunar periods.

Wind Factors
Analyzes wind speed and direction to identify high-catch conditions, backed by industry research.

Temperature
Monitors air and water temperature trends to pinpoint bass feeding moods, accounting for thermal lag.

Sky Conditions
Evaluates sunny or overcast skies alongside wind to refine your fishing strategy.

Feeding Times
Provides GPS-specific solunar data, accurate to the minute, to target major and minor feeding windows.
Top 3 Ways Bass Forecast Boosts Your Fishing Success
Anglers love Bass Forecast, the #1 AI-powered bass fishing app, for making every trip count. Powered by real-time AccuWeather data and AI-driven insights, here’s how we help you catch more bass.
Plan Smarter with 10-Day Forecasts
Maximize your fishing time with 10-day Bass Forecast Ratings (BFR) and push notifications for GOOD and EPIC days. Plan ahead to land your personal best, just like thousands of Lunker Club members.
Master Bass Patterns
Our AI tailors bait recommendations, lake locations, and presentation strategies to bass behavior, weather, and seasons. Many anglers report catching trophy bass with our PRO tips, even on tough days.
Learn more about Premium Features.
Pinpoint Feeding Times with Spot-On Solunar Data
Bass Forecast’s GPS-specific solunar data, accurate to the minute via US Naval Observatory, identifies major and minor feeding windows, no manual calculations needed.

.png)
.png)